BMS / HVAC · REMOTE TECHNICAL REVIEW
Clear evidence. Practical next steps.
Remote review of BMS graphics, control documents and operating data for BMS/HVAC integrators and engineers. Receive a PDF report and Excel register showing findings, supporting evidence and the next checks.
01 / SERVICES
Turn documents and data into decisions.
From investigating control issues to checking consistency before handover, each review connects the available evidence with the next action.
01 / REVIEW
Control issue analysis
Compare operating trends, control specifications and settings to investigate issues such as poor temperature tracking or unstable control.
DELIVERABLEAnalysis of possible causes, supporting evidence, proposed actions and further checks.
02 / REVIEW
BMS graphics review
Cross-check graphics against point lists and control specifications for missing information, incorrect references, units and permitted operator actions.
DELIVERABLEA documented issue list with evidence and proposed corrections.
03 / REVIEW
Document and settings review
Compare specifications, settings and change records to clarify differences and their approval status.
DELIVERABLEA list of discrepancies, recorded reasons, approval status, required updates and open questions.
Scope, source documents and deliverables are agreed before work begins. Findings are provided in a PDF report and an Excel review register.
02 / SAMPLE WORK
From a finding to the next check.
These fictional examples show the review approach: identify a discrepancy, compare the evidence and define what needs checking next.
Explore the sample deliverables.
These are fictional examples based on simulated records, not client outcomes.
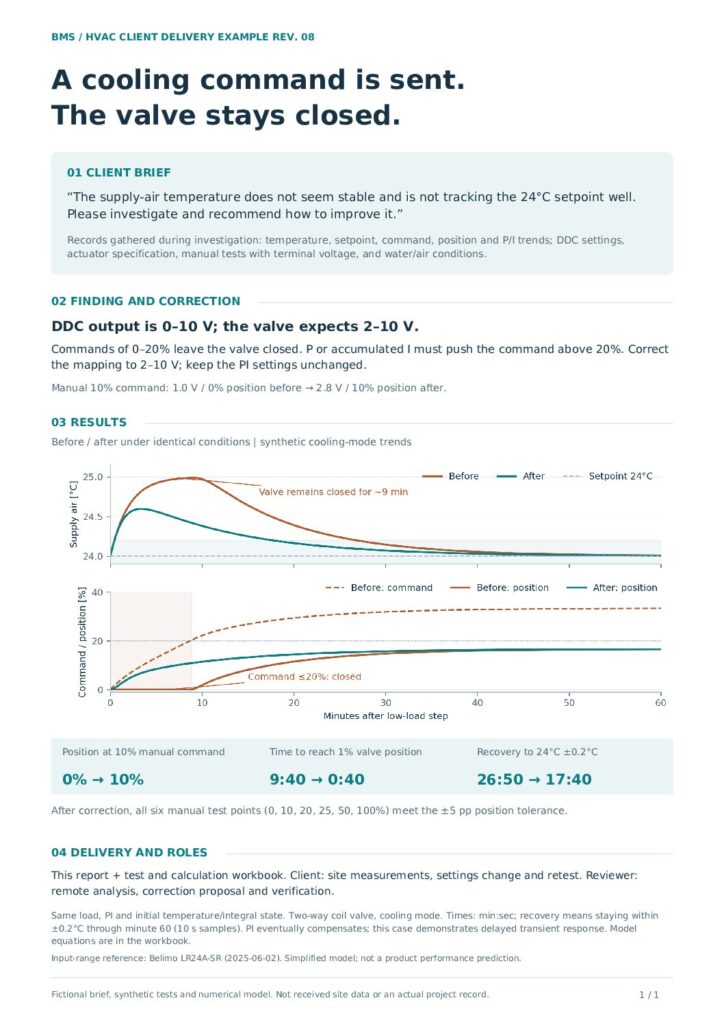
Investigating heating and cooling valve signal ranges
A simulated review comparing trends, specifications and settings, with the next checks documented.
Open sample PDF · 1 page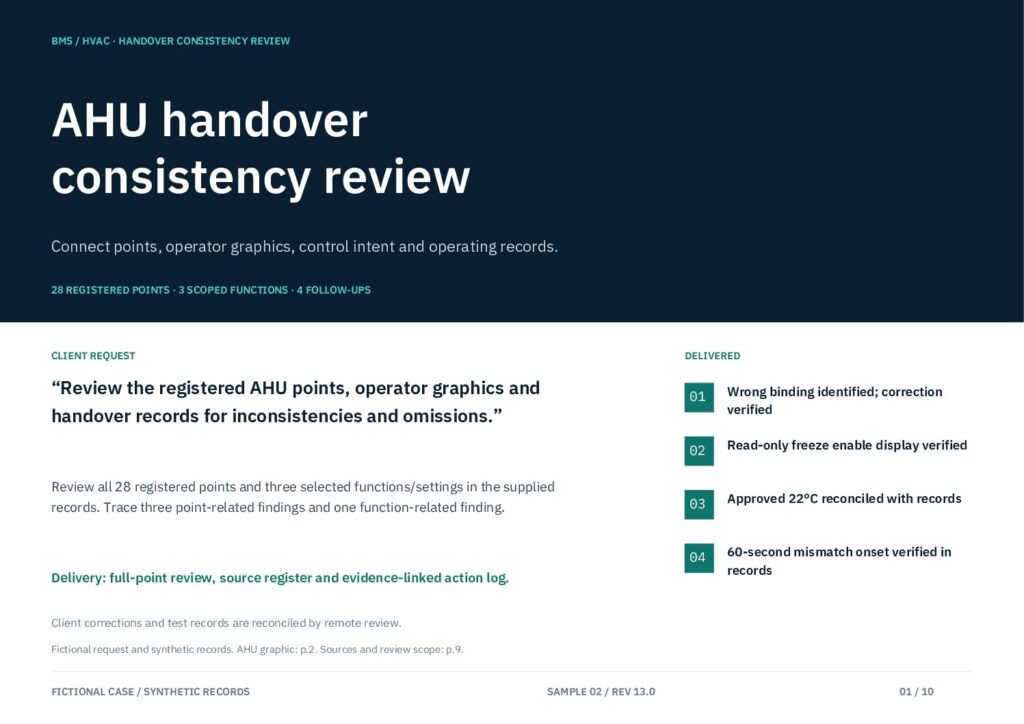
Checking graphics and documents before handover
A simulated review comparing graphics, point lists and control records, with supporting evidence and proposed corrections.
Open sample PDF · 10 pagesSAMPLE 01 / SIGNAL RANGE
A command is sent, but the valve stays closed.
- 01 / FINDINGA command is sent, but the valve stays closed. Examine behavior at low commands.
- 02 / EVIDENCEDDC output uses 0–10 V while the valve expects 2–10 V. Compare the two signal ranges.
- 03 / NEXT CHECKVerify the output scaling, then review the test records supplied after the customer makes the approved change.
Fictional requests and simulated records. Values are illustrative, not measured client data or guaranteed equipment performance.
SAMPLE 02 / GRAPHIC REVIEW
Standby does not tell you whether protection is enabled.
A frost protection status of Standby does not distinguish enabled from disabled. Compare the graphic and point list, then propose a separate read-only indication of the actual enable state.
BEFORE
- Operating status
- Standby
- Enable state
- Not shown
AFTER / PROPOSAL
- Operating status
- Standby
- Enable state
- Enabled (example)
Check the point reference and read-only configuration, then verify the Enabled, Disabled and Unknown displays. Fictional request and simulated records; this is a proposed display, not a completed client project.
ILLUSTRATIVE / TREND VIEW
Read the relationship,
not just a value.
Compare setpoint, temperature and output on the same time axis. Separate plots preserve the temperature and output units.
Illustrative traces only. Correlation alone does not establish cause; compare specifications, settings and operating conditions.
03 / WORK PRINCIPLES
Think beyond the immediate finding.
Three principles guide how findings become useful to the person who acts on them.
01 / CLARITY
Clarity
Lead with the key finding and the evidence needed for a decision. Present information in a form the next person can use.
02 / FORESIGHT
Foresight
Consider the work that follows the review. Identify potential issues and the checks needed before they become harder to resolve.
03 / EVIDENCE
Evidence
Separate observed facts, possible causes and unanswered questions. Identify the next document, setting or record to check.
04 / WHY KEISOU MASTER
Make technical knowledge easier to use.
CLARITY IN COMPLEXITY.
Keisou Master began as a place to explain instrumentation and control technology clearly, helping engineers find information, understand it and make decisions. Remote review support extends that purpose to project documents and operating data, with the aim of reducing uncertainty and making the next step easier to plan.
The aim is to reduce uncertainty and help people plan their next action. This describes the working philosophy; the examples above are simulated.
Profile (Japanese)05 / TECHNICAL LIBRARY
Technical articles (Japanese)
Explore Japanese-language articles on building management systems, automatic control, equipment, electrical signals and heat.
06 / WORKING TOGETHER
Start with what you need to understand.
Tell us about the equipment or graphic, your BMS, the issue you want reviewed, the types of documents available and your preferred timing. You do not need a complete document set for an initial enquiry. Feasibility, scope, deliverables, price and timing are agreed before work begins.
01
Share the context
Describe the equipment or graphics, BMS name, concern, available document types and preferred timing. An incomplete document set is fine for the initial enquiry.
02
Agree the scope and quotation
We confirm feasibility and the required documents, then agree the items to review, reference document versions, exclusions, deliverables, price and schedule before work begins. Pricing depends on the graphics, point count, scope and condition of the source materials. Additional items or new specification changes are quoted separately.
03
Receive the initial review
Receive a PDF report, an Excel issue register and an explanation of the findings. Items that cannot be verified because information is missing are recorded separately from findings awaiting correction.
The initial graphics review includes one recheck of corrections to its original findings. Timing and unused-recheck terms are agreed in the quotation.
Scope, responsibilities and recheck terms
The initial graphics review includes one recheck of corrections to its original findings. After completing the necessary approvals, corrections and on-site checks, the customer submits one complete set of before-and-after graphics, settings and required test records. That set is rechecked once and the register is updated. The initial review is complete on initial delivery, including when there are no findings or corrections are deferred or unnecessary. The timing of the recheck and treatment of an unused recheck are agreed in the quotation.
Reviewer: Remote review, documentation of findings and review of supplied correction and retest records.
Customer: Document provision, required on-site measurements, approved changes, retesting and submission of the resulting records.
The enquiry form is on the Japanese request page. Fields, in order: Name, Email, Subject, Message. You can write your enquiry in English.
For enquiries from this website, please use the contact form.